Statistics
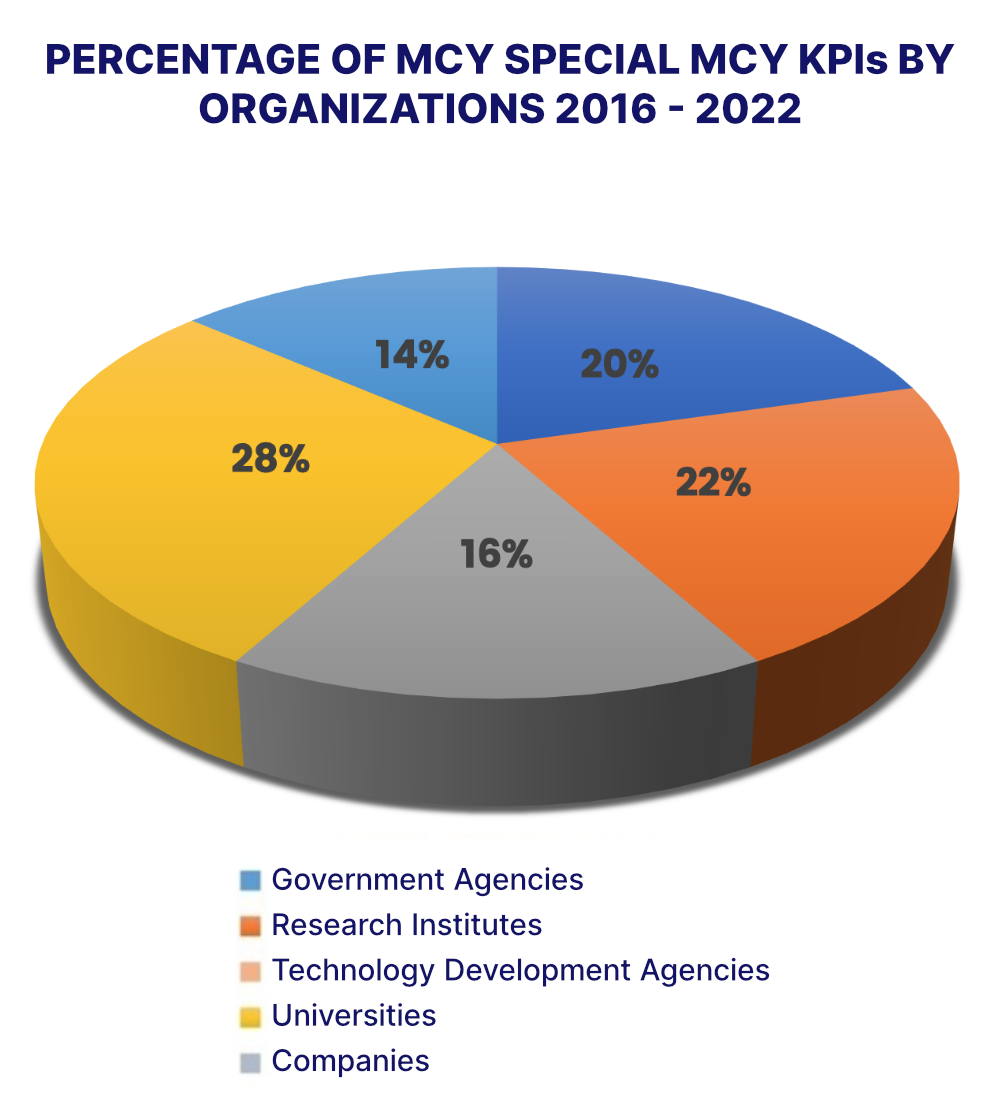
A total of 474 products/technologies/services have been successfully commercialized in the local and international markets with sales value of more than RM540.0 million for the year 2016 until 2022. Universities contributed the highest number of products/technologies/ services which is 136 (29%), followed by Government Agencies, 126 (27%) and Technology Development Agencies, 88 (18%).
 |
Year / Type Of Organisation | 2016 | 2017 | 2018 | 2019 | 2020 | 2021 | 2022 | Total |
| Government Agencies | 34 | 26 | 12 | 7 | 10 | 6 | 2 | 97 | |
| Research Institutes | 40 | 40 | 6 | 4 | 7 | 3 | 2 | 102 | |
| Technology Development Agencies | 25 | 18 | 12 | 7 | 9 | 1 | 4 | 76 | |
| Universities | 28 | 39 | 9 | 18 | 12 | 16 | 13 | 135 | |
| Companies | 3 | 10 | 1 | 4 | 5 | 22 | 19 | 64 | |
| Total | 130 | 133 | 40 | 40 | 43 | 48 | 40 | 474 | |
| Commercialisation Value : RM 540,041,323.74 | |||||||||
Note: The list of MCY Special KPIs refer to products/technologies/services that comply with the following criteria:
- Products/technologies/services that are new or have been upgraded (up scaled) from existing products/technologies/services;
- Sales revenue generated in the current year or cumulative sales revenue of the second half of the previous year (July to December);
- Licensing agreements must be signed in the current year; and/or
- Royalties received are from sales made in the current year or the cumulative sales results of the second half of the previous year (July to December).


